For many B2B companies – especially in tech and SaaS – a productive Sales Development Representative (SDR) team can be the driving force behind revenue growth. They can also be a huge drag on company resources if they're not producing results.
One challenge we sometimes hear from SDR managers and RevOps leaders: how to quantify the impact the SDRs have on pipeline.
While SDRs are on the front lines, engaging prospects and qualifying leads, understanding the true extent of their influence on qualified opportunities often requires more than just surface-level metrics.
Fortunately for companies using HubSpot, there are several useful reports that when taken together can help you measure the real contributions of your SDR team.
We've compiled a few HubSpot reports that measure SDR impact with instructions for setting them up.
Let's dive in.
Opportunities Created by SDR
 This tends to be one of the big ones from the leadership team and executive level: how many opportunities are SDRs creating?
Creating this report is relatively simple; the trick is finding the best way to attribute opportunities to the right SDRs. I recommend using a custom contact and deal property like "SDR Owner" that gets populated when a deal is created that's associated with a contact previously owned by an SDR.
To do this:
- Use deal-based workflow trigger: associated contact SDR has ever been known.
- Copy SDR contact owner to SDR deal owner
Create the report
- Create report > custom report builder
- Data source: Deals
- Line graph
- Configure data
-
- X-axis: create date
-
- Y-axis: count of deals
-
- Break down by SDR owner
- Add filters
-
- SDR deal owner is known
-
- Create date (choose desired reporting date range)
Now, you have a report that tells you how many opportunities each SDR generates over time.
Tip: clone this report, change the data source to activities and change the Y-axis to meetings booked to see how many meetings each SDR is booking.
Target Accounts Touched by SDR
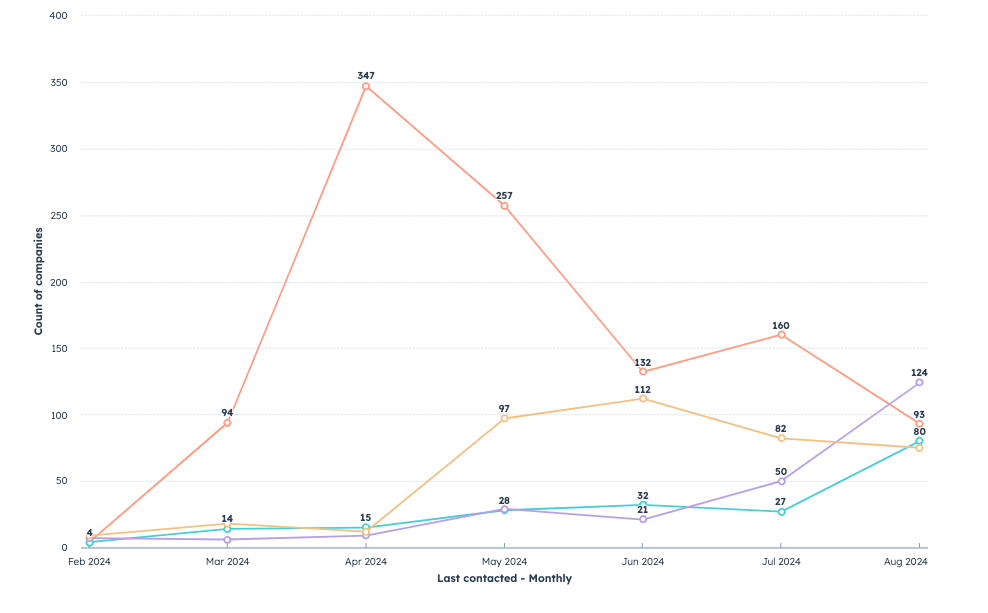
If you're executing an account-based marketing and sales strategy and part of the SDR team's objective is to penetrate these accounts, you're likely also keen to understand how many of these accounts your SDRs are touching through activities like calls, email, SMS and LinkedIn.
Enter the Target Accounts Touched by SDR report.
Create the report
- Create report > custom report builder
- Data source: Contacts, Companies, Deals and Activities
- Line graph
- Configure data
-
- X-axis: Last contacted
-
- Y-axis: count of companies
-
- Break down by SDR owner
- Add filters
-
- SDR deal owner is known
-
- Target account = true
-
- Create date (choose desired reporting date range)
With this report, you don't have to ask or wonder how many target accounts each SDR is touching – it's all right here.
Activities by SDR
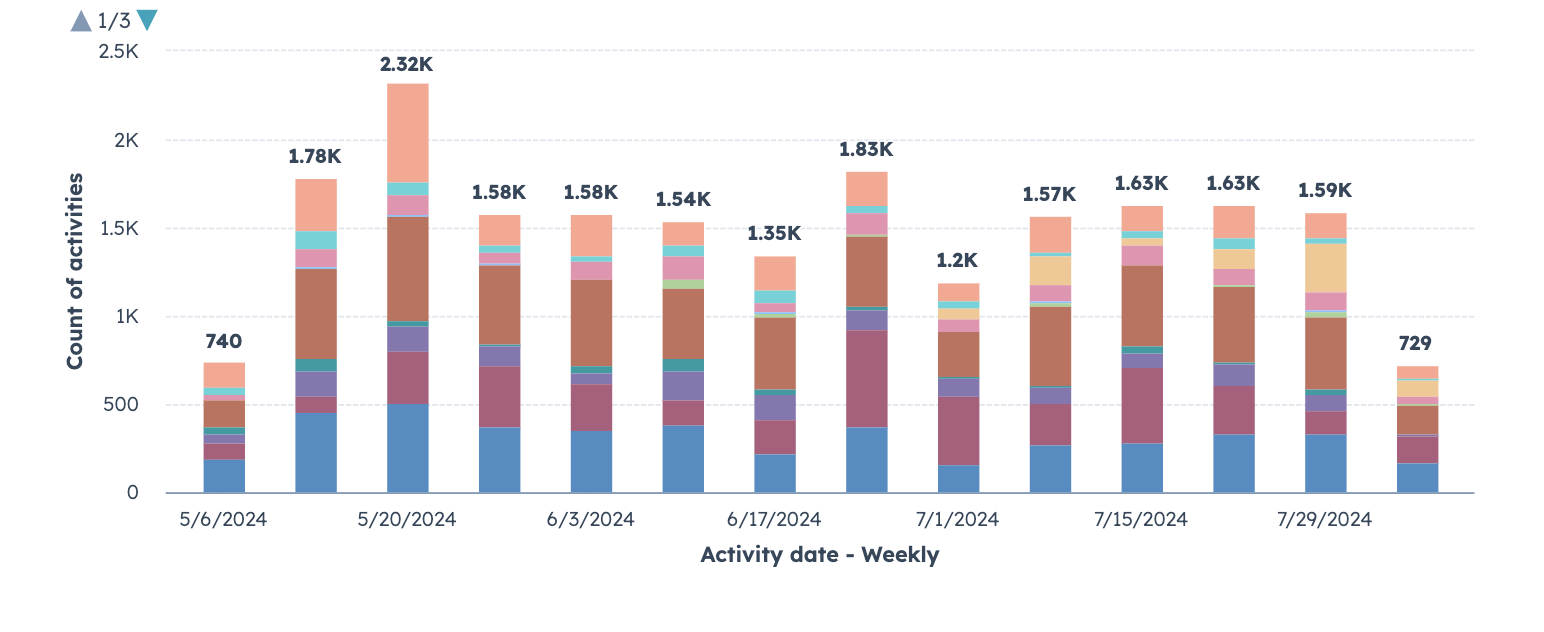
Of course, activities are not the same as impact, but if you're measuring impact (a lagging indicator) it's good to look at that in context with activities (a leading indicator). That's why we advise including activity reports alongside impact reports on the SDR dashboard.
Create the report
- Create report > custom report builder
- Data source: Activities
- Bar graph
- Configure data
-
- X-axis: Activity date
-
- Y-axis: count of activities
-
- Break down by activity assigned to
- Add filters
-
- Activity assigned to is equal to SDR team
-
- Activity date (choose desired reporting date range)
Not only does this report shed light on the activity volume of the SDR team, it also helps explain how these activities influence pipeline.
Number of Account Touches to Meetings Booked by SDR
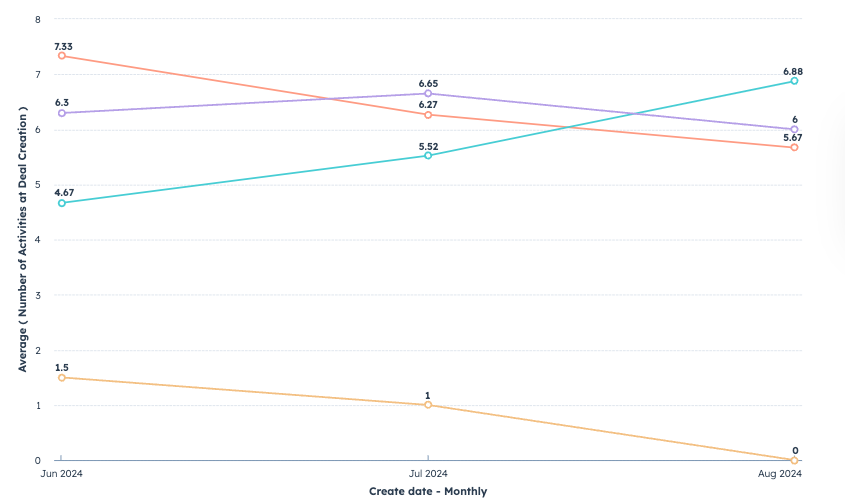
When thinking about SDR impact in terms of meetings booked, it helps to not only understand the number of meetings, but how efficiently these meetings are being generated.
To understand this, you can create a metric and report to track how many touches on average SDRs need to have with an account before a meeting is booked.
Before creating the report, you'll need to create a custom deal property and workflow to calculate the number of activities logged at the point of deal creation.
To do this:
- Create the custom deal property (field type: number)
- Create a deal-based workflow that enrolls new deals and copies the number of sales activities to your new property above.
Create the report
- Create report > custom report builder
- Data source: Deals and Activities
- Line graph
- Configure data
-
- X-axis: Deal create date
-
- Y-axis: Average (number of activities at deal creation)
-
- Break down by SDR owner
- Add filters
-
- Activity assigned to is equal to SDR team
-
- SDR deal owner is known
-
- Deal create date (choose desired reporting date range)
Along with quantifying the efficiency of SDR activities when it comes to booking meetings, this also helps with capacity and future hiring planning as it shows how many activities are needed to hit SDR goals.
No-Shows by SDR
If you're like many of the clients we work with, the no-show struggle is real. Maybe the SDRs are loading up calendars with meetings, but if a good portion of those meetings are no-shows, that's not only an inflated and potentially misleading metric – it's wasting time with sales resources.
Create the report
- Create report > custom report builder
- Data source: Contacts and Activities
- Line graph
- Configure data
-
- X-axis: Contact create date
-
- Y-axis: Number of meetings with outcome of no-show
-
- Break down by SDR owner
- Add filters
-
- Activity assigned to is equal to SDR team
-
- SDR contact owner is known
-
- Contact create date (choose desired reporting date range)
Now, you have a way to tell how many no-shows are occurring by rep and – if you're taking steps to minimize them – a report that shows whether those efforts are working.
Getting Started
Needless to say, there are plenty of other metrics your business may want to have to help measure SDR impact, but hopefully this batch provided some good starting points.
Need a hand building out your HubSpot dashboards and reports? Drop us a line – we'd be happy to help.