“How many clicks and conversions did our ads get last month? Is there more organic traffic coming to the website?” Good questions. Ones you will definitely need to answer on a regular basis. This is where reporting swoops in to save the day!
Reporting is crucial for businesses to measure the success of their marketing campaigns in concrete terms. It helps quantify a return on investment by comparing the costs of marketing efforts against the gains. Further, analyzing and understanding the data (conversion rates, for example) provided by reports can empower strategic decision–making.
For any business trying to compete today, powerful performance reporting is a must. Setting a regular cadence for reporting, ideally every month, is a must for communicating performance; especially when marketing pivots need to be made to correct course.
So, you need the best tools of the trade to power those decisions. Two of the best applications for this purpose are Databox and Google’s Looker Studio (formerly Google Data Studio).
Choosing the correct product is vital for getting the best results. Databox has been our go-to for reporting because of its slick design and easy to read data comparisons. However, Looker Studio is far more extensible and offers increased customization, for deeper interpretation of performance. For advanced reporting and calculations, it’s the superior choice.
But what is right for your business? Let’s look at what they can do and what they do differently.
Databox
Databox is a business analytics platform designed to provide businesses with real-time insights into their performance. Founded with the mission to make performance data more accessible and actionable, Databox has grown to become a favorite among businesses looking for user-friendly and customizable dashboard solutions.
Key Features
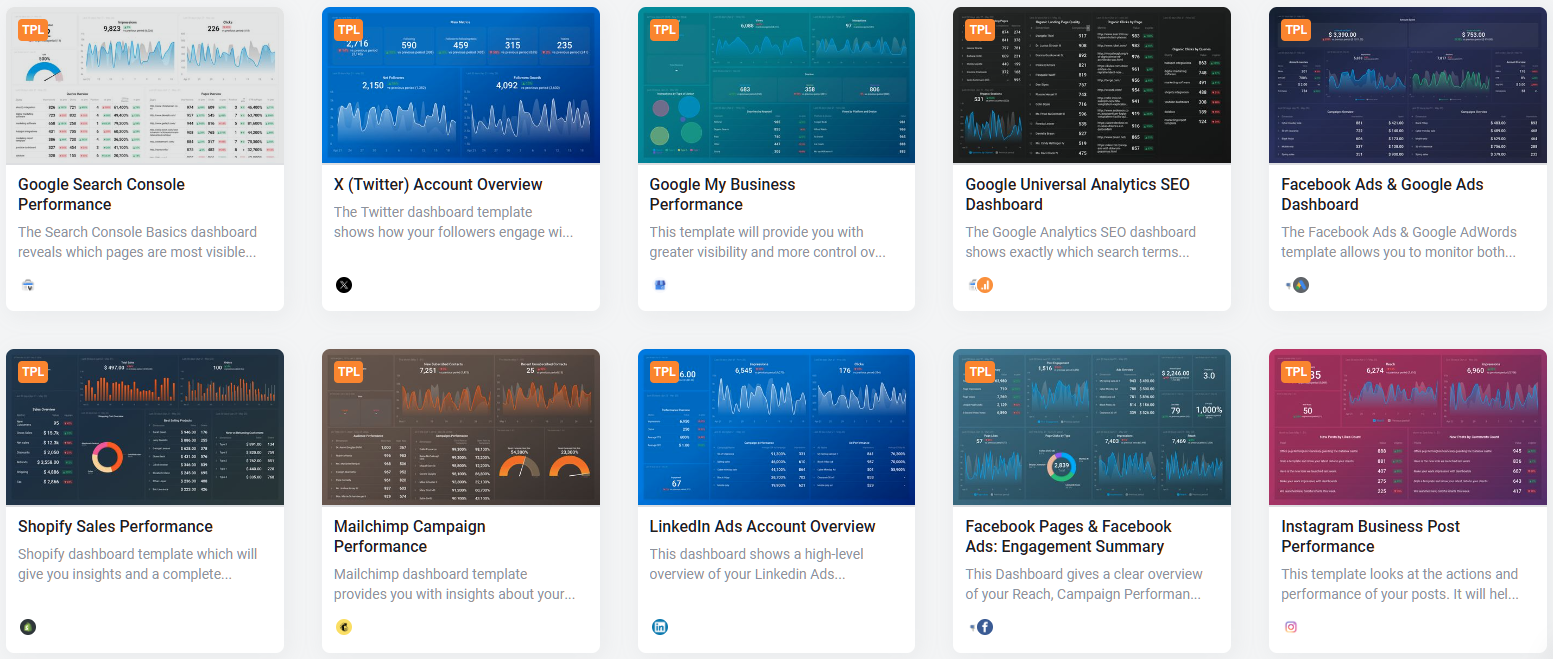
- Customizable Dashboards: Databox allows users to create visually appealing and highly customizable dashboards (called “databoards”), enabling businesses to track key metrics in real-time.
Ex. Databox Public Templates

- Integration Capabilities: With over 70 native integrations, Databox seamlessly connects with various data sources such as CRM systems, marketing platforms, and social media channels.
- Mobile Accessibility: Databox’s mobile app ensures that users can access their data on the go, providing flexibility and convenience.
- Performance Tracking: The platform offers features like goal setting, alerts, and scorecards to help businesses stay on top of their performance metrics.
Looker Studio
Looker Studio is a free tool offered by Google that enables businesses to create customizable reports and dashboards. It utilizes Google’s infrastructure and integration capabilities, making it a popular choice for data visualization.
Key Features
- Data Connectors and Integration: Looker Studio supports a wide range of data connectors, allowing users to pull data from various Google services and third-party platforms.
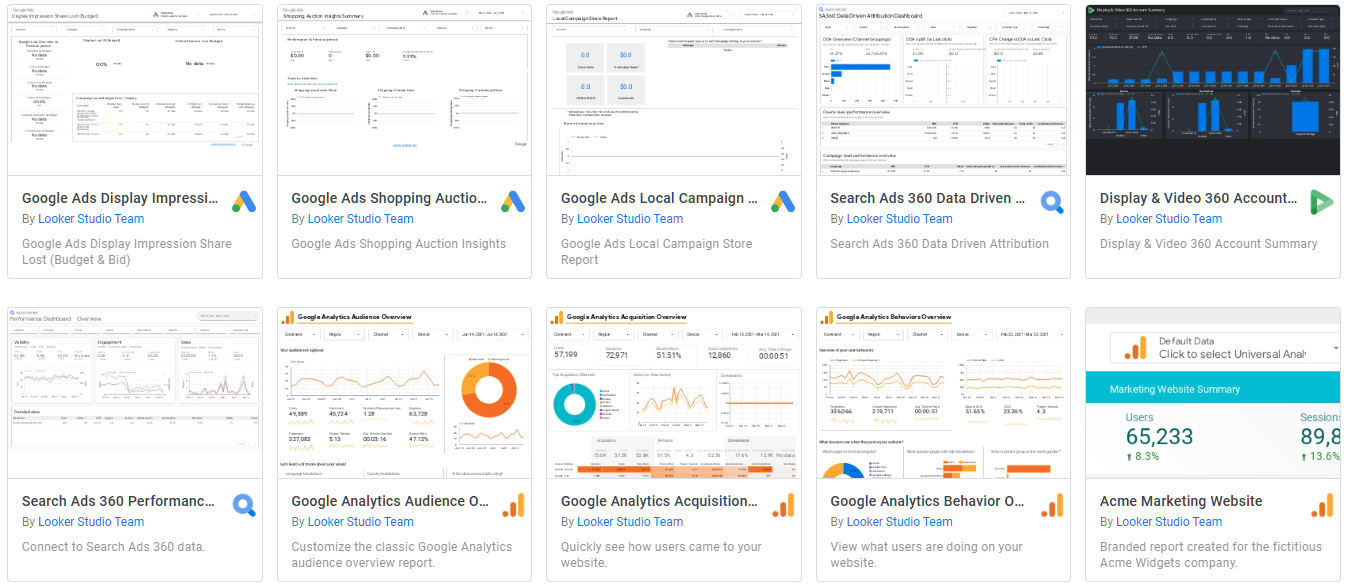
- Custom Reporting and Visualization: Users can create highly customizable reports and visualizations tailored to their specific needs.
Ex. Looker Studio Template

- Collaboration Features: Looker Studio facilitates team collaboration by allowing multiple users to work on the same report simultaneously, enhancing productivity and teamwork.
- User-Friendly Interface: The platform’s intuitive drag-and-drop interface makes it easy for users of varying skill levels to create and share reports.
Now that we have touched on their key features, let’s compare the differences between Databox and Looker Studio.
Feature and Benefit Comparisons
User Interface and Ease of Use
- Databox offers a clean, intuitive interface with easy drag-and-drop functionality, making it accessible for users without technical expertise. Its focus on real-time data visualization helps businesses stay up to date with their performance metrics.
- Looker Studio also provides a user-friendly interface with drag-and-drop features. However, its interface may seem more complex initially, especially for users unfamiliar with Google’s ecosystem. Despite this, it offers extensive customization options for those willing to invest time in learning the platform.
Integration and Data Sources
- Databox excels with over 70 native integrations, including popular tools like HubSpot, Google Analytics, Facebook Ads, and more. This wide range of integrations allows businesses to centralize their data from various sources into a single platform.
- Looker Studio supports hundreds of data connectors, particularly those in Google’s ecosystem, such as Google Analytics, Google Ads, BigQuery, and Sheets.
- It also connects with several partner platforms, but users may need to rely on third-party connectors for certain integrations, which requires more setup time and could potentially involve the service of a developer.
Customization and Flexibility
- Databox provides customizable templates and widgets that can be tailored to specific needs, making it easy to set up and use. This includes custom metrics and custom calculations.
- Looker Studio offers more advanced reporting capabilities, allowing users to create intricate and detailed visualizations. This flexibility can be a significant advantage for businesses with complex data analysis needs.
Collaboration and Sharing
- Databox facilitates collaboration by allowing users to share dashboards with team members and clients. It also supports real-time updates and alerts, ensuring everyone stays informed using a shared link.
- Looker Studio stands out in collaboration, enabling multiple users to work on the same report simultaneously. This feature, combined with its sharing options, makes it a powerful tool for teams needing to collaborate on data analysis.
Pricing
- Databox offers a variety of pricing plans, including a free tier with basic features and several paid plans (ranging between $47/month to $799/month) that provide additional functionalities and integrations. The pricing is scalable, catering to different business sizes and needs.
- Looker Studio is free to use, which makes it highly attractive for businesses looking for a cost-effective solution. However, some advanced features and integrations may incur additional costs if utilizing paid Google services or third-party connectors.
Which Tool is Right for Your Business?
Both platforms have advantages and disadvantages. Let’s explore those characteristics with pros, cons and why you should choose them.
Databox
Pros:
- Visually appealing, well-designed charts and dashboards
- Ready-to-Use databoard templates
- User-friendly interface, extensive integrations, real-time data updates, mobile accessibility
- Excellent technical support
Cons:
- May be limited for very large enterprises, some advanced features are only available in higher-tier plans
- Text editor is difficult to use; no zoom available in the Designer
- Frequent, unannounced application updates that affect usability
- Occasional instability and program crashes
Looker Studio
Pros:
- Free to use
- Strong collaboration features
- Excellent integration with Google ecosystem
- Multiple data sources can be blended for advanced comparison
- Individual charts and overall reports are highly customizable
- Advanced calculations and built-in mathematical functions are available
Cons:
- Initial learning curve
- Some integrations may require additional connectors (like Zapier, for example)
- Very limited direct customer support
- Performance declines sharply as more integrations, charts, and data blends are added
The Takeaway
Both Databox and Looker Studio offer robust data visualization capabilities, each with unique strengths. Databox is great at real-time data visualization and ease of use, while Looker Studio excels in customization and integration within the Google ecosystem. From my experience, for quick, out-of-box dashboards that can be set up and shared, Databox is for you. If advanced data crunching is more your style (and need), Looker Studio is more appropriate.
Ultimately, the best tool will depend on the specific needs, goals, and resources of a business. Performance reporting is indispensable for any business to succeed in a competitive marketing environment. It quantifies ROI for marketing efforts and empowers data-driven strategies and decisions. We recommend trying out both platforms to see which one aligns best with your marketing goals.
Regardless of the reporting app, being able to measure the performance of your marketing efforts is a must. Would you like personalized guidance choosing the right data visualization tool or want to maximize your digital marketing efforts? Drop us a line; we’re happy to help! For more insights and updates, subscribe to our newsletter and explore our related resources.