Are you tired of guessing whether your marketing efforts are paying off, or having to jump through hoops to gather concrete data to back up your marketing ROI?
When it comes to sales and marketing, results are everything. But monitoring results across different channels and campaigns to prove ROI can be a very labor-intensive task.
Luckily, the product team at HubSpot understands the value of spending less time sorting through information and more time making data-driven decisions and has created new features that will help make this every marketer's reality. In this blog post, we will introduce you to three HubSpot reporting tools that will help you bust your marketing reporting wide open. Let's dive in!
Multi-Touch Revenue Attribution
Think of the last time you closed a deal. How many marketing and sales touchpoints were involved in leading up to the purchase? Four? Six? Now think about where you awarded credit for the deal. Google? A trade show? Perhaps you simply named the source that generated the contact, despite the touchpoints that occurred in between.
But wouldn't it be nice to trace revenue back to specific marketing activities that occurred after landing the lead?
Insert, HubSpot's Multi-Touch Revenue Attribution.
With HubSpot's multi-touch revenue reporting feature, a proportion of revenue can be assigned to each activity that leads up to a "closed-won" deal. In other words, you can now track revenue for different marketing activities, such as emails, landing pages, blog posts, social media engagements, CTA clicks, page views – you get the picture. And you can even report on these activities in multiple dimensions. For example, you can track how much revenue was attributed to a CTA click, and what proportion of revenue from those clicks came from each source.
Now, you might be wondering, "how can a single platform tie a closed won deal to a CTA click?"
Well, when you set up your revenue attribution report in HubSpot, you can choose from seven different models that all attribute revenue to activities in various ways. These include:
- First-touch attribution: all revenue generated is attributed to the first touchpoint that the lead or customer interacts with.
- Last-touch attribution: all revenue generated is attributed to the last touchpoint that the lead or customer interacts with.
- Linear attribution: all generated revenue is equally attributed to all touchpoints in the customer journey.
- Time decay attribution: more generated revenue is attributed to touchpoints that occur closer to the time of the sale or deal closure.
- U-shaped attribution: 40% of the revenue generated is attributed to the first and last touchpoints, and the remaining 20% is attributed to other touchpoints in between.
- W-shaped attribution: 30% of the revenue is attributed to each of the first and last touchpoints, and the remaining 40% is attributed to other touchpoints in between.
- Full-path attribution: revenue is attributed to all touchpoints in the customer journey, weighting each touchpoint based on its impact on the sale or deal closure.
Measuring success across these different attribution models allows you to compare the revenue generated by each touchpoint in the customer journey and the percentage of revenue attributed to each touchpoint in each model. By providing a clear understanding of which marketing channels and activities are driving the most revenue, you'll be better equipped to optimize your marketing strategies and increase your ROI.
Customer Journey Analytics
Have you ever found yourself wondering what would be the impact on your sales opportunities if you stopped doing paid ads? Or if your nurturing workflows from last month's webinar are actually working?
With HubSpot's customer journey analytics feature (available in Marketing Hub Enterprise), you can determine the impact of each interaction a contact has with your brand by analyzing conversion rates and the time between touchpoints. This feature tracks every touchpoint in the customer journey, from the first website visit to the final conversion or deal closure, across multiple channels and devices so you can answer questions like, how many leads are coming in? How many of those are converting into MQL or SQL? And from there, how many of those are converting into opportunities and customers?
To do this, you'll need to set up a customer journey report in HubSpot which shows the flow of contacts through different stages of the sales funnel. The report displays the paths that contacts take as they move from one stage of the funnel to the next, and how many contacts move through each stage. You can then analyze conversion rates and time between touchpoints by looking at different metrics such as bounce rates, click-through rates, page views, etc. to understand the effectiveness of your marketing and sales efforts at different stages of the funnel. It also helps you identify where contacts are dropping off in the funnel, so you can optimize your marketing and sales strategies accordingly.
For example, this report below is showing a customer journey that starts with an ad interaction and then leads to MQL and opportunity. The width of the flow lines represents the number of contacts moving from one stage to another, while the color of the lines can be used to represent different properties of the contacts, which in this example, is their lead source and lifecycle stage. The report can be customized to show different stages of the funnel (like this one) or focus on specific properties of the contacts.
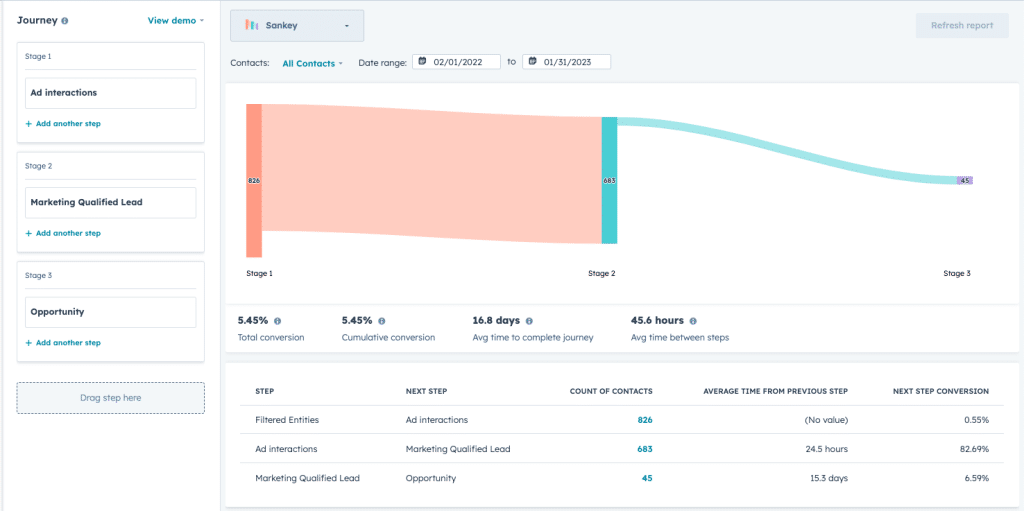
With a visual representation of the customer journey, conversion rates and time between touchpoints, you can determine the impact of each interaction and its role in driving the customer toward a purchase decision. And by identifying where contacts are dropping off in the funnel, you can optimize your marketing and sales efforts to improve conversions and revenue.
Advanced Marketing Reporting
As a marketing professional, you understand the continuous pressure to prove the effectiveness of your campaigns and initiatives. But in a business climate that's frequently changing, it's becoming increasingly harder to simply navigate the landscape, much less justify your efforts. We get it.
As of the writing of this post, HubSpot has officially combined its two powerful reporting features (Multi-Touch Revenue Attribution and Customer Journey Analytics) under the new name "Advanced Marketing Reporting" for all Marketing Hub Enterprise customers.
By combining these two powerhouse reporting features, you'll have access to all unified data needed to:
- Prove your business impact, optimize your campaigns and allocate budget with more certainty.
- Know what's driving revenue, whether it be an email campaign, social media engagement, a landing page, etc.
- Measure every marketing moment to understand what's working and what's not.
- Better understand your customers, improve their experience and strengthen relationships under a single roof.
In addition, Advanced Marketing Reporting allows you to track the performance of your marketing campaigns over time and compare different campaigns against each other. This can help you identify trends and patterns in your marketing performance and make data-driven decisions to allocate your marketing budget more effectively, improving your overall ROI.
Start Improving Your Bottom Line
Proving your marketing is working (or uncovering where the problem lies if it isn't) sounds like a tall order. But with Advanced Marketing Reporting, it no longer has to be.
If you're ready to learn how to better understand your marketing, prove ROI and optimize your efforts without constraining budgets, we're here to help. Contact us today.