
PostHog vs. Google Analytics
There’s a new kid on the website analytics block named PostHog. And it wants to unseat best Google Analytics as the top performance–measuring product among engineers and product teams. PostHog has some very interesting features and built-in tools. But don’t forget about the great capabilities that made Google Analytics the industry powerhouse it is today!
Not familiar with PostHog’s Product Analytics? Then sit back and read our introduction. Afterwards, we will compare its toolset to the features offered by Google Analytics.
Let’s take a look at both, what they can do, and what they do differently.
PostHog
Launched in 2020, PostHog is an open-source product analytics platform that helps companies understand user behavior, track interactions, make data-driven decisions, and optimize their products. The platform is designed to provide a comprehensive understanding of user behavior without compromising privacy.
According to the website, PostHog is “The single platform to analyze, test, observe, and deploy new features.” It was initially built to address the limitations of traditional analytics tools and to provide a more flexible and accessible solution to drive growth. It emerged as an open-source alternative to existing product analytics platforms. The project rapidly grew in popularity due to its user-centric approach to analytics.
Here’s an overview of its features and components:
Interactive Toolbar
PostHog provides a toolbar that can be launched on top of your website. It allows you to inspect elements on the page, perform heatmap analysis, assign actions to links and buttons for event tracking, and other useful features.

Event Tracking and Capture
PostHog allows you to capture user interactions and events within your application. These events can be actions users take, such as clicking a button, signing up, or making a purchase. By tracking these events, you can gain insights into how users are engaging with your product.
Dashboard Creation
With PostHog, you can create customizable dashboards to visualize your data. Dashboards provide an easy-to-understand overview of key metrics and trends. You can add charts, graphs, and tables from your Insights to track important KPIs and monitor the performance of your website.

Insights
The platform provides tools for analyzing captured data. You can perform cohort analysis, funnel analysis, retention analysis, and more to understand user behavior and identify areas for improvement. These insights help you optimize user journeys and increase conversion rates.
Analyze Funnels
Funnel Analysis helps you understand the steps users take to achieve a specific goal, such as completing a purchase. By tracking user flow through different stages, you can identify drop-off points and optimize the conversion process.
Analyze Cohorts
Cohort Analysis groups users based on common characteristics or behaviors. This helps you compare the performance of different user segments over time and understand how changes impact user engagement.
Analyze Retention
Retention Analysis helps you measure user engagement and retention rates. You can track how often users return to your product after their initial interaction, enabling you to gauge the long-term value of your users.
Feature Flags
PostHog allows you to implement feature flags, which are toggles that control the visibility of specific features within your application. This enables you to gradually roll out new features, perform A/B testing, and ensure a seamless user experience.
Event Autocapture
This feature automatically captures common user interactions without requiring manual event tracking implementation. It simplifies the process of collecting relevant data for analysis.
Custom Event Properties
You can attach custom properties to events, allowing you to enrich your data with contextual information. This helps in-depth analysis and segmentation of user behavior.
Actions and Insights Automation
Actions in PostHog allow you to set up automated responses based on user behavior. For example, you can trigger an email campaign when a user completes a specific action, like signing up.
Usage-Based Pricing
PostHog offers a free, basic version of the analysis product that is “best for early-stage startups and hobbyists,” according to the website. For the professional-level package that accommodates the greater volume needed for larger businesses you will have to pay for a premium subscription based on usage. The more you use the platform, the more expensive it can become.
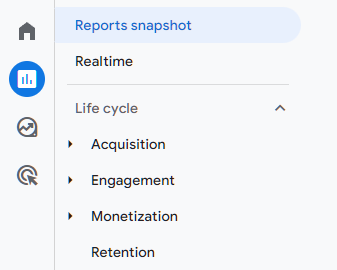
Google Analytics 4
Google Analytics is a powerful web analytics service that allows businesses and website owners to track and analyze various aspects of their website’s performance and user behavior. It provides valuable insights into user engagement, traffic sources, conversions, and more, helping businesses make informed decisions to optimize their online presence.
This Google Marketing Platform product has been the reigning analytics and measurement champ for well over a decade. Many users learned about Analytics from the original Universal Analytics version, which has migrated to the new GA4.
Let’s learn more about the industry go-to measurement tool:
Comprehensive Data Analysis
Google Analytics offers an extensive suite of tools for tracking and analyzing various aspects of website and app performance. It provides insights into user behavior, traffic sources, conversion rates, and more, helping businesses understand how their online presence performs.

User-Friendly Interface
The user interface of Google Analytics was designed to be intuitive and user-friendly. Both beginners and experienced users can navigate the platform easily without extensive technical knowledge.
Customizable Reporting
The platform allows users to create customized reports based on their specific needs. This flexibility enables businesses to focus on the metrics that are most relevant to their goals, improving decision-making processes.
Conversion Tracking
Important user events that align with the goals of a business can be marked as conversions. These might include completing a purchase, signing up for a newsletter, or reaching a specific page. Google Analytics tracks these actions and provides data on the conversion rate, the sources of converting traffic, and the paths users took to complete the goals.
Real-Time Data
Google Analytics provides real-time data updates, allowing users to monitor live website activity and react promptly to emerging trends or issues.

Integration with Other Google Products
Google Analytics seamlessly integrates with other Google services like Google Ads, making it easier for advertisers to track the effectiveness of their campaigns and connect advertising efforts to website performance.
Ecommerce Capabilities
For online stores, Google Analytics offers ecommerce features (called the Google Merchant Center) that allow businesses to list products, add inventory, monitor sales, revenue, and product performance. This enhances data-driven strategies for improving online sales.
Mobile App Analytics
With the growing importance of mobile apps, Google Ads Mobile App extends its reach to track app performance using a smartphone. This feature enables advertisers to understand user engagement, retention, and interactions from their mobile devices.
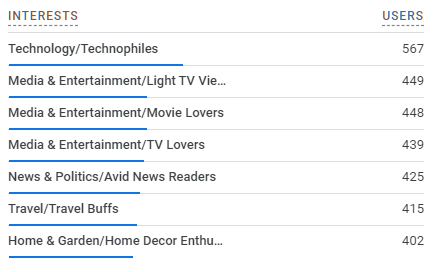
Advanced Segmentation
Google Analytics provides advanced segmentation options, enabling users to segment their audience data based on various criteria such as demographics, traffic sources, and user behavior. This feature facilitates a deeper understanding of different user segments and their interactions with the website or app.
Regular Updates and Support
Google consistently updated and improved Google Analytics, ensuring that the platform remained relevant and capable of adapting to the evolving landscape of web and app analytics. Additionally, Google’s robust support infrastructure helps users troubleshoot issues and make the most of the tool.
Free Entry-Level Version
Google Analytics offers a free version that provides a substantial range of features suitable for small to medium-sized businesses. This affordability and accessibility makes it a popular choice for businesses looking to monitor their online performance without a significant upfront cost.
So what sets them apart? Let’s take a look at the pros and cons of both platforms.
PostHog
Pros:
- Data Ownership and Privacy: PostHog is open-source* and allows you to host and manage your data. This ensures more control over data ownership and addresses some of the privacy concerns associated with third-party services.
- Event Tracking and Creation: PostHog focuses on event tracking, enabling you to track user interactions and actions in detail, which can be especially useful for product-focused businesses. The process of adding conversions (called Actions) is as easy as clicking on an element while using the toolbar, or creating an action from a recorded event in the PostHog Event Explorer.
- Flexible and Customizable: Since it is open source, you can customize and extend PostHog’s capabilities to suit your specific needs.
- Cohort Analysis: PostHog emphasizes cohort analysis, helping you understand how different groups of users behave over time.
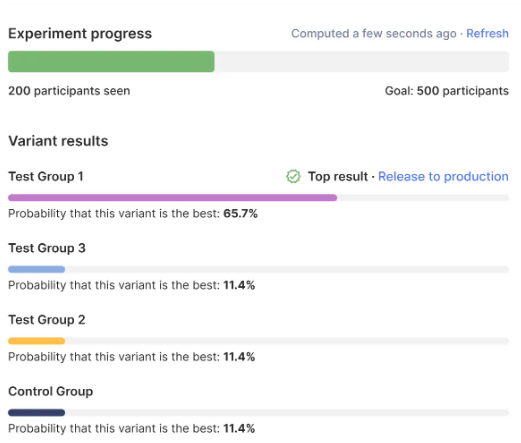
- A/B Testing: PostHog offers built-in A/B testing functionality, which is essential for testing and optimizing different versions of your product or website.
* Denotes software for which the original source code is made freely available and may be redistributed and modified.
Cons:
- Learning Curve: PostHog has a steeper learning curve compared to Google Analytics, especially for users who are not familiar with writing custom events and scripts.

- Limited Integrations: While PostHog is versatile, it has fewer out-of-the-box integrations compared to the longer-established Google Analytics.
- Volume-Based Pricing: PostHog charges based on volume for unrestricted use of the product. This can be expensive depending on how much traffic a website receives, and how much analysis your business needs.
Google Analytics
Pros:
- User-Friendly Interface: The interface is designed to be user-friendly, making it relatively easy for beginners to navigate and use. However, using advanced features such as custom reporting (called Explorations), requires more technical know-how.
- Integration with Other Google Services: If your organization uses other Google services (like Google Ads and Tag Manager), Google Analytics can easily integrate with them, providing a more unified view of your online presence.
- Advanced Segmentation: You can create custom audiences to analyze specific subsets of your website traffic, helping you understand how different user groups interact with your site.
- Comprehensive Support: Google has a well-established library of support documentation, with articles, videos, case studies, and developer tools.
Cons:
- Creating Conversions: Modifying default events and creating new conversions in Analytics 4 is not exactly intuitive. A knowledge of scripting languages definitely comes in handy for this process.
- Data Ownership and Privacy: Since Analytics 4 is proprietary and owned by Google, there are concerns about data privacy and ownership. Some users (especially in Europe) worry about sharing sensitive data with a third-party company.
- Sampling: In the free version of Google Analytics, data is sampled* in reports when dealing with large amounts of data, potentially leading to less accurate insights.
- Limited Customization: While Google Analytics is powerful, there might be cases where you need more customization and flexibility than it offers.
* Sampling is the practice of analyzing a subset of all data in order to uncover the meaningful information in the larger data set.
The Takeaway
Deciding which analytics product works for you depends on your specific business needs and priorities. If you’re looking for a user-friendly, comprehensive solution with a vast ecosystem of integrations right out of the box, Google Analytics might be a better fit. On the other hand, if you prioritize data ownership, customization, and advanced event tracking, PostHog could be more suitable.
Measure Your Website Performance
Both Google Analytics and PostHog offer event tracking, analytics, funnel analysis, and user behavior insights. However, PostHog emphasizes more granular event tracking, user timelines, an interactive toolbar, and data control through self-hosting, while Google Analytics benefits from over a decade of proven implementation, a large user base, and its deep integration with the broader Google ecosystem. The choice between the two would depend on factors like your specific tracking needs, data privacy concerns, your preference for self-hosting, and cost.
Regardless of platform, reviewing your website’s performance should always be top of mind for your business. Would you like personalized guidance tailored to your specific analysis needs? Drop us a line; we’re happy to help!


