

Have you ever looked at your Google Analytics and thought, “this is great but what am I supposed to do with my website analytics data?”
If you’ve been scratching your head over this, you’re not alone.
The good news is you’re already taking the important first step: looking at your analytics. It’s something we recommend doing at least monthly so that you can make informed updates to your website.
We’re digging into the key metrics to look at in your Google Analytics and what they might be telling you.
Website Analytics Considerations
Before we start, it’s important to recognize that analytical interpretation isn’t one-size-fits-all.
For instance, if your website goals are focused on lead generation, then you’ll likely prioritize users, sessions and goal completions, while if your goals are focused on awareness and education then you might prioritize sessions, session duration and bounce rates.
In this blog, we’ll cover a range of metrics. That doesn’t mean that every time you see a high bounce rate the guaranteed answer is below, but these will give you insights into what it could be and what else to look for.
Let’s get started.

Users and Sessions
Users and sessions are two important metrics that often get mislabeled.
Users are the total number of individual people who come to your site. They are only counted once. Sessions are the number of times your website (or page) was visited. A single user can have multiple sessions.
So what does this mean for you?
Equal users-to-sessions ratio:
If the number of sessions is relatively in line with your number of users, people aren’t returning to your website. This could mean one of two things:
- Your content isn’t resonating with your website visitors. If you’re also seeing high bounce rates and low time on page, you’ll want to address your content.
- If your goal completion rate is high, this may indicate that your website is getting people to the next step in the conversion process, so optimizing this doesn’t need to be a priority.
High sessions-to-users ratio
If you have significantly more sessions than visitors, your content is successfully bringing people back to your site. Now it’s time to focus on what’s bringing them to the site and how they’re engaging once they’re there.
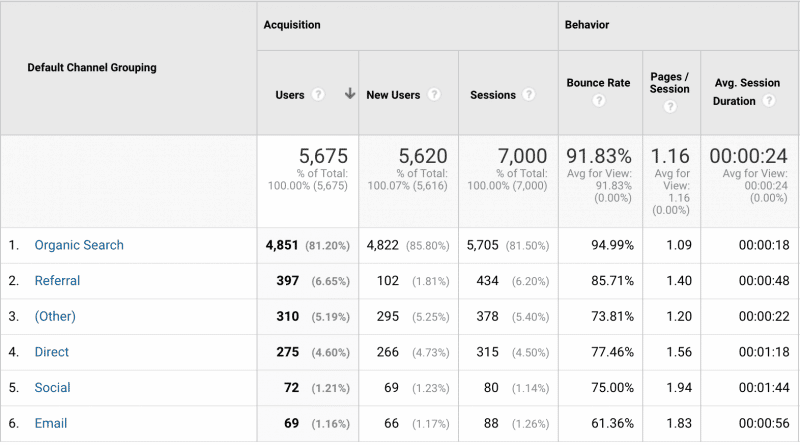
Traffic Channel
Traffic channel sheds light on how your users are getting to your site. By understanding where your traffic is coming from, you can identify potential areas of opportunity, as well as better understand the health of your channels.
When you look at your on-page analytics, it’s important to consider how the data varies based on your traffic channel. For example, if your email marketing is seeing higher goal completions and on-page activity than social media, you know that email is driving more engagement than social.
In addition, seeing how diversified your traffic channels are can help you see the overall health of your marketing efforts. You should aim for a healthy division between multiple channels rather than relying on one or two.
As we discuss the next metrics, take note to consider them by traffic channel.

Bounce Rate and Exit Rate
Bounce rates and exit rates can tell you a lot about your website. First, let’s define what these terms mean:
As defined by Google Analytics:
- For all pageviews to the page, Exit Rate is the percentage that were the last in the session.
- For all sessions that start with the page, Bounce Rate is the percentage that were the only one of the session.
- Bounce Rate for a page is based only on sessions that start with that page.
With that in mind, they can tell you a lot about how your website is (or isn’t) meeting your audience’s needs.
Bounce rates
Before we talk about what your bounce rates might mean, it’s important to understand what a normal bounce rate is.
A RocketFuel study found that most websites see bounce rates between 26% and 70%, with the average being 45%.
To break that down further:
- 26% to 40% is excellent
- 41% to 55% is average
- 56% to 70% is above average
- Over 70% high (for everything other than blogs, news, and events pages, which typically see higher bounce rates)
Depending on the traffic channel, a high bounce rate may indicate:
- Organic traffic: Your metadata might not be accurately representing your page content, leaving visitors’ expectations unmet. On the contrary, if your metadata is accurate, the content on your site might be underdelivering. As mentioned, blog traffic tends to have higher bounces rates, so don’t be alarmed if yours does! Blog visitors typically come to a site looking for one piece of information, so it’s common for them to leave after finding what they needed.
- Social media or email traffic: Your content might not be meeting the expectations of your visitors. Alternately, if the bounce rate is high but time on page is also high, you may have relevant data and could benefit from adding a newsletter sign-up form or goal to the page.
- Paid traffic: Typically, these are associated with higher bounce rates. If your goal completions are high, don’t get too caught up in this metric.
- Mobile traffic: Double check that your website is mobile responsive and that there aren’t too many pop-ups, chatbots and other features taking up the mobile display.
While having a low bounce rate is the goal, bounce rates that are too low may indicate a problem as well.
If it’s below 20%, confirm that your analytics tagging is properly implemented. To that point, if your website bounce rate is above 90%, it may indicate an error in your tracking code setup or a website compatibility issue.
Exit rates
If you have high exit rates on pages that also have a high goal completion rate, this may be telling you that your visitors have found what they need at that point in time and have completed an action to take the next step in engaging with you.
If your goal completion rates are low on pages with high exit rates, it’s a clue that you need to rethink the page content or goal.
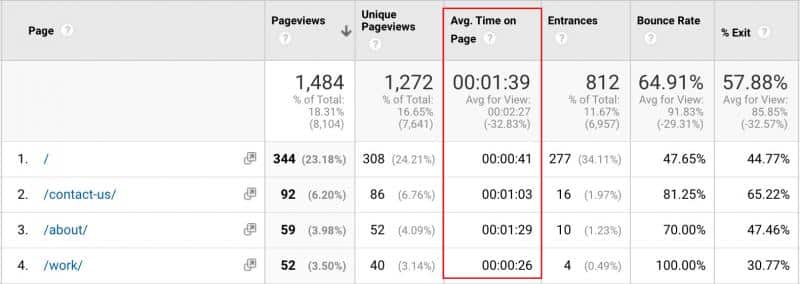
Average Time on Page
This metric can help determine how people are consuming your website content in a few ways. While there’s not a magic number to indicate an exact high or low average time on page, Jetpack shares a great explanation of things to consider as we dig into this metric.
High time on page, low bounce/exit rate
If users are spending a long time on a page and then moving on to more pages of your site, this is likely an indicator that your visitors are consuming the content and continuing on to learn more.
High time on page, high bounce/exit rate
If your users are spending a long time on the page and then leaving, consider the following:
- The blog is answering all their questions: On a blog or news article for example, they may leave once their question has been answered or interest has been satisfied. If you don’t have a newsletter sign-up form or relevant content offer on these pages yet, consider adding one to collect contact info before they leave.
- They found what they need for now: If the page in question isn’t a blog or news piece, a high time on page and high bounce/exit rate may indicate that the user found what they need. If goal completions are also high, don’t stress over this metric.
- Your page is too complicated: If people are spending a lot of time looking for answers on a page only to leave, it could be an indication that you need to revisit your page structure or content. If the time on page and bounce/exit rates are high but the goal completions are low, it might be time to rethink your content.
Low time on page, low bounce/exit rate
If the time on page is low but users are continuing to more pages of the site, this could be reinforcing that your content is digestible and is meeting the needs of your audience. If you’re also seeing a high goal completion rate, then keep up the good work!
Low time on page, high bounce/exit rate
Alternately, if users are quickly leaving a page it could be a sign that:
- The page speed is slow
- The page design is hard to follow
- The page isn’t mobile responsive
- The page isn’t meeting the expectations of your site visitors
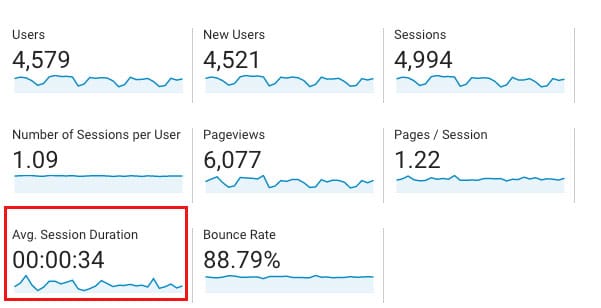
Average Session Duration
The average session duration considers the total amount of time a visitor spent on your website.
A low average session duration with low goal completions may indicate that your site isn’t meeting the needs of your audience and that you need to revisit the messaging, design or overall user experience.
On the contrary, a low session duration with high goal completions could mean you’ve created an easy-to-follow user experience that quickly gets your audience to convert.

Average Pages Per Session
Pages per session can tell you about how someone explores your website, which may uncover some room for optimizations. A few key scenarios that should be examined include:
- High pages per session, low session duration and low completion rate: The likelihood in this situation is that your visitors think they’ve come to the right place (your website), but they can’t find the information they’re looking for (no matter how many pages they look at).
- Low pages per session, high bounce/exit rates and low completion rate: Your site content might be confusing to visitors, causing them to think they’re in the wrong place.
- High pages per session and high goal completion rate: If this is your analytics pattern you might spend some time examining how to streamline your conversion paths. Typically, the fewer pages someone needs to view before converting, the better.

Goal Completions
Goals are an important way to measure if your site is effective. They’re designed to measure “conversions,” which are completed activities that you can define in Google Analytics.
Common goals include product purchases, content downloads, quote request forms, contact forms, or email newsletter sign-ups.
Depending on the page that has a low goal completion rate, your analytics might be telling you:
- You’re at the wrong stage of the buyer’s journey: Putting a quote request form on a blog for the awareness stage of the buyer’s journey is likely to see low conversions. In this example, you might change your goal for the page to be an email newsletter sign up.
- You’re asking for too much: If your content download isn’t converting, this could be an indicator that you’re asking for too much in exchange for the download. Consider reducing the amount of form fields.
- Your content download isn’t high-value to that audience: If your form isn’t asking for much information, it may also indicate that your content download isn’t valuable to your audience. It may be better utilized as free blog content, or on a page of your site that speaks to a different buyer persona.
- The page content is misaligned: If you aren’t converting sales or quote requests, you may be missing key decision-making content on the page.
- You’re attracting the wrong users: High traffic to your site is only valuable if it’s traffic from your target audience. If you aren’t completing your goal, it might be time to revisit your SEO target keyword and your blog content to make it more relevant for your desired customer.
What To Do With Your Website Analytics Data
Now that you know some things to look for, it’s time to dig into your analytics. We recommend looking at least once a month, with a deeper audit of your site every quarter.
Once you identify the highest priority analytics to improve, you can create an optimization plan to help test and improve your content (we recommend using this conversion rate optimization testing calendar).
Still not sure where to start? We know a team that can help with everything from monthly reporting to managing tests to helping you make strategic website optimizations.


