So, you’ve built a campaign strategy for your business. Your emails are scheduled to send. Your workflows are on. You’ve created landing pages with clear, concise copy and engaging CTAs. You’re officially launched!
Now what?
Once your marketing campaign has started, many businesses make the mistake of “setting and forgetting” them. If you want all your hard work to pay off, it’s crucial to track your campaign throughout its life. By using the right tools, you’ll be able to pick up on what strategies are successful, which aren’t panning out and where you can improve performance.
When it comes to tracking campaigns, HubSpot has you covered. Here, you can find all the detailed analytics you need to steer your campaigns in the right direction and hit your goals.
Let’s look at the tracking tools HubSpot has to offer:
First Things First – Create Your Campaign
For our friends who haven’t tracked a campaign yet, let’s touch on creating one in HubSpot.
Creating a campaign allows you to have a centralized place to host your assets and get a high-level overview of their performance. (We’ll go into the tools that give a more detailed look in a minute!)
Under the “Marketing” menu tab on HubSpot, scroll to “Campaigns.” Then, press “Create Campaign” in the upper right-hand corner. You’ll be asked to fill in some basic information about your campaign and then taken to your new campaign page. Press “Add Assets” in the right-hand corner and select the different pieces of content associated with your new campaign. This includes blogs, emails, workflows, lists and forms.
Your campaign page and your Campaign Analytics report (found under the “Analytics tabs) are helpful for a quick view of your campaign’s success or to point out warning signs. The Campaign Analytics tab focuses on the contacts influenced by your related assets like emails, landing pages and forms. Your campaign page will go a little more in-depth, with an overview of all of your associated assets. Here, you can get a quick look at form submissions, email performance, social media engagement and landing page traffic.
Once your assets are all tracked in your campaign, we can start exploring and using the more in-depth tracking tools HubSpot offers.
Customized Dashboards
HubSpot’s dashboard feature allows you to add analytics reports that are most important to you and your campaign, all in one place. The campaign page and Campaign Analytics tab are useful, but you can create a customized analytics report here.
Take a look at this example dashboard I created for Simple Machines. If I were running a new campaign, I’d be interested in how my emails are performing, how many form submissions I received and my landing page traffic. With dashboards, I can add and organize those reports in a way that work best for me.
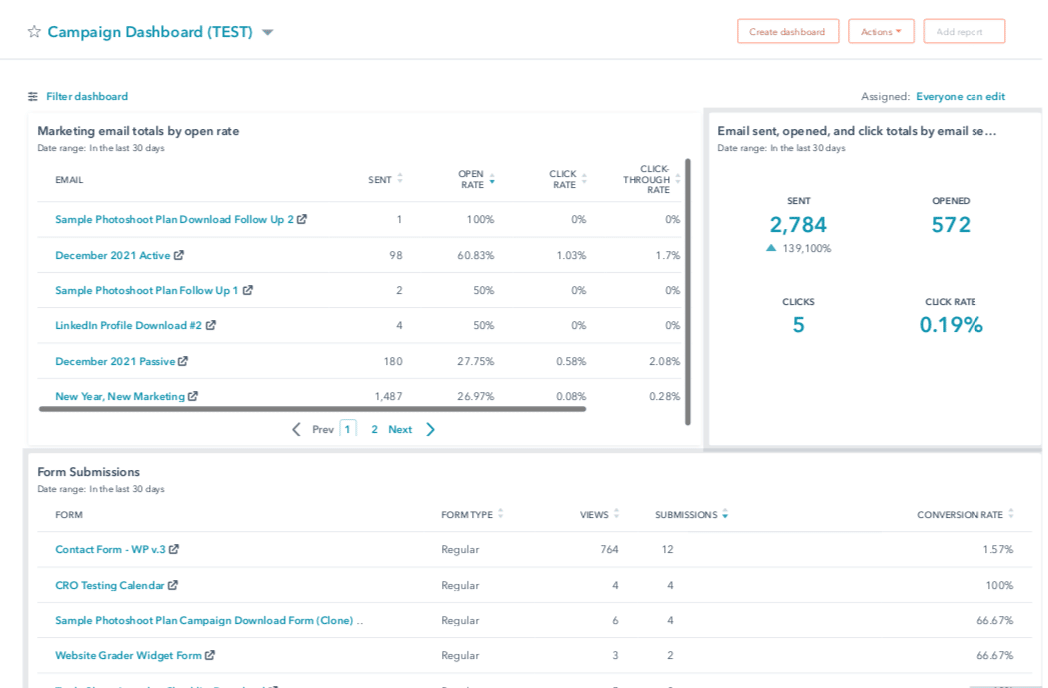
Go to your HubSpot campaign page and press “Create Dashboard” in the upper right corner to create a custom dashboard. HubSpot offers several helpful templates for dashboards for more commonly requested reports. When customizing one for your campaign, I suggest choosing a blank dashboard. There, you can search for the reports you need – form submissions, landing page sessions, email analytics, etc. – and add them to your new dashboard.
Go back to your homepage, and boom! An in-depth look at your campaign, right on your homepage.
Now, dashboards are great (and in our opinion, underutilized!) but let’s dig into some specific tracking tools for the different assets of your campaign.
Email Analytics and Health
Head over to your Marketing Email homepage. We bet you’ve created an email or two here under the “Manage” tab, but have you explored the ones next to them?
Email “Analyze” Tab
If your campaign is email-heavy, this is where you need to be. Here, you can analyze the performance stats for each of your emails and every individual campaign.
This comprehensive tool offers:
- Recipient Engagement
- Delivery, bounce, unsubscribe and spam report rates
- Email performance by device type (mobile, desktop, etc.)
- Email performance over time (daily, weekly and monthly)
- Click rate and CTR performance
If you’d like to see this information for only a certain amount of time or specific campaigns or emails, you can change those settings in the designated area about your first data set.
Bonus Tip: If you see a report here that you’d like on your campaign dashboard, press the “Actions” button in the upper right corner of each data set. There, you can add it to your desired dash!
Email “Health” Tab
This feature is relatively new. Even if you’re a seasoned email tracker, you may have missed this one.
Email health refers to your emails’ deliverability and how it appears in your audience’s inboxes. If your emails are consistently marked as spam or hard bouncing, that’s a red flag to your email platform. Your deliverability will decrease, meaning you’re less likely to arrive successfully in your audience’s inbox.
This tab breaks down individual aspects of your email performance and assesses their health:
- A tracker of your current email health, and whether there’s significant action needed to improve it, slight changes needed or you’re already on track. (If you press “Over Time” in the upper right corner, it will show a graph of your email health over the last year and how it’s fluctuated.)
- HubSpot’s recommendations for working on your email health. This is a helpful feature because it gives you actionable first steps to take in your next emails.
- An email health breakdown of your open, CTR, bounce, unsubscribe and spam report rate. By clicking “See Details,” you’ll get a specific email health score for that segment, as well as a chart of its performance over time. (Plus, they link to a few additional guides to read up on if you’re feeling lost.)
If you’re seeing declining delivery rates and increasing hard bounces in your campaigns, start at the “Health” tab. HubSpot puts the stats, recommendations and resources you need for improving your emails all in one place.
Form Analytics
Is your campaign focused on conversions? Your Form analytics page can help you decide if your CTAs are driving conversions or need tweaks.
Click on “Lead Capture” under “Marketing” on your main menu and then on “Forms.” There, next to the “Manage” tab, click on “Analyze” (seeing a pattern?) From there, you’ll get three major data sets:
- Aggregated form data, which shows your form’s views, conversion rates and submissions.
- Your total form submissions compared to the number of form views you received.
- A chart of all your forms individually, listing views, submissions and conversion rates.
Again, you can also change the date or specific forms you’d like to few at the top of your page.
Psst! You can take the same action here as you did on your email analytics page – add additional reports to your dashboard by pressing “Save Report.”
You may notice a button labeled “View detailed analytics” in the upper right-hand corner. This will automatically take you to your “Forms” analytics page, which can be found under the main menu’s “Reports” tab. This gives you similar information as the Forms “Analyze” tab, showing submissions, conversion rates and form views over a certain amount of time but with an additional graph where you can compare submissions to sessions and conversions and form views.
Social Media Analytics
Just like with email and form analytics, you can track your social posts’ performance under two tabs – “Monitor” and “Analyze.”
(First, you’ll need to connect your social accounts to your HubSpot – learn how to do this here.)
Let’s start with the “Analyze” tab:
Social Media “Analyze” Tab
Your social media “Analyze” tab gives you a comprehensive look at your audience engagement, broken down by platform. You can customize your settings to look at a single platform or multiple, choose a date range and even compare social performance between two date ranges.
This page covers:
- How many followers you have on each platform
- How many posts you’ve published
- Audience interactions, impressions, sessions and clicks
- How many times your posts have been shared
- A graph breaking down your most popular posts by most interactions, impressions and clicks
(You know the drill – add these reports to your dashboard if you want to keep track of social performance!)
Social Media “Monitor” Tab
This feature isn’t for reporting – it’s for keeping track of the people who engage with your posts. Get a response to one of your LinkedIn posts? You can write back to them right in HubSpot. Did someone retweet you? Thank them on your social “Monitor” page! Learn more about the “Monitor” tab here.
Traffic Analytics
Let’s look at how to track the engagement on your website – specifically, landing pages and blog posts. These vital statistics let you know how long people are spending on your website, how exactly they got there and more.
Start by heading to your “Reports” tab in the main menu and click on “Analytics Tools.” Then, on your “Analytics” report tab, click on “Traffic Analytics.”
You have a myriad of customization options on this page! Pick your desired date range and data point range (daily, weekly or monthly), and then we suggest exploring the “Pages” tab.
Here, under “All page types,” you can choose to compare the performance of all your pages (landing pages, blog posts, etc.) to each other or isolate one of them. Then, you’ll see a graph you can customize based on your desired statistic. This can be changed by clicking the drop-down arrow under the graph title. Besides page views, your other options include page submissions, bounce rate, click rate and more.
Below, you’ll get a chart listing the performance of your individual pages, which you can edit to your liking under “Edit Columns.” Add the analytics you’re most interested in and remove the ones you don’t need.
If you’re interested in going even deeper into your website pages’ analytics, explore the other tabs listed at the top, including “Sources,” “Topic Clusters,” “UTM Parameters,” “Countries,” “Browsers” and “Devices.” Learn more about each of these additional segments in detail here.
Get Tracking!
HubSpot doesn’t play around when it comes to reporting. They have so many resources and tools to keep you in the know about your campaign’s health, successes and obstacles. By now, you should have a good idea of where to start when it comes to building customized reports to track your campaigns and where to find the detailed statistics you’re looking for.
Interested in running marketing campaigns on HubSpot to grow your business but don’t quite have the time to devote to them? We’re here to help. Learn more about our services as a HubSpot certified partner.


