
Our team started using Databox in 2020, and it’s been a total game-changer for our client reporting process.
But we also remember how it felt to start from scratch with Databox. There were so many customizable features that we didn’t know where to start! But as our team personalized our clients’ databoards, we discovered how to get the most out of our Databox subscription and use it to its full potential.
So, I’m here to give you the Databox optimization tips that we wish we had when we started. But first, let’s take a quick tour to get an idea of Databox’s layout.
Navigating Databox

Once you’ve created your Databox account, you’ll be greeted by your dashboard. At the end of your setup process, this is where you can save some of your favorite metrics for easy access.
Speaking of databoards, let’s head there next.
Databoards
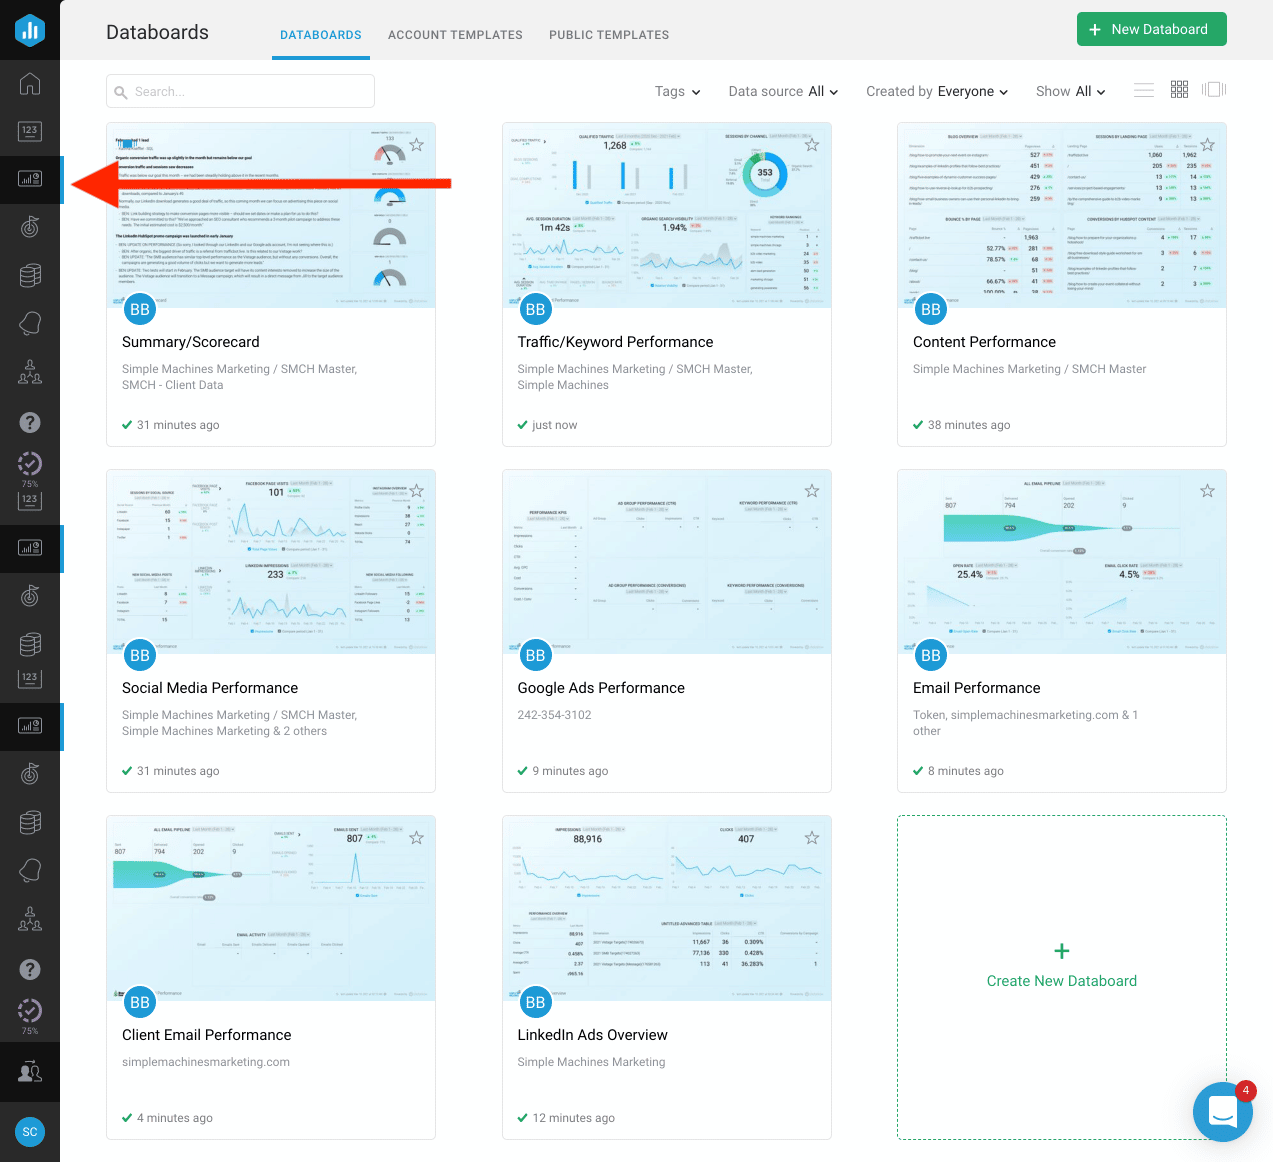
The Databoards tab is where you create the skeleton of your report.
For Simple Machines, we have a few different databoards that cover our important metrics – traffic, social media performance, email performance, etc. We’ve also added a Summary card, which we include for all our clients. This gives them a quick hits list on overall monthly progress before they dive into the specifics.
When creating a Databoard, you’ll get the chance to start from scratch or use the Databox Wizard (oooOoooo!) The Wizard helps guide you through adding the metrics you need for each databoard (we’ll cover these next!), which we recommend for first-timers.

You’ll get the chance to choose between all of the analytic sources you’ve added and the specific metrics you need. Then, you can edit and customize your databoards to your liking – change spacing, titles, colors and more.


Metrics
I didn’t forget – let’s cover metrics!

The Metrics tab is where you connect your top data sources, like HubSpot, Google Analytics and social platforms like Facebook or LinkedIn. With over 70 integrations, Databox almost certainly has the data source you want to track. Browse them by clicking the “Select a data source” dropdown menu.

Once you connect a data source and choose your metrics, you can then add them to your databoards successfully.
TIP: You can save a ton of time here by having all of your login credentials for your data sources in front of you, instead of having to search for them!
Optimize Your Databox
Phew, okay. Now that we’ve covered the basics, let’s focus on enhancing your boards.
Get Organizing
Start by reviewing your chosen databoards and what you’d like to see on each one. Keeping them organized by an overall theme will help you digest all those numbers more easily. These themes could include:
- Marketing Assets and Analytics: Divide up your cards using themes like Traffic, Content Performance, Landing Page Performance, Email Performance, Paid Ad Performance, Conversions, etc.
- Data Source: Create individual boards by source – Google Ads, Bing Ads, Facebook, LinkedIn, MailChimp, Constant Contact, HubSpot, etc.
- Goals: Say your marketing goals include growing LinkedIn followers, increasing MailChimp email open rates and getting more views on your blog posts. You can keep all of these essential metrics on one page dedicated to Goals.
TIP: The Summary card can also be a useful place to put key stats from the past month front and center, such as follower count, conversions or organic traffic levels
Once you’ve decided on an organizational strategy that makes sense for your team, you can link all of your databoards together by pressing “Share Dashboard,” scrolling to where it says “Loop Dashboards” and press “Add Databoards,” which will create one centralized shareable link.
Next, it’s time to choose your databoard content.
Get Specific
Sure, Databox can give you generalized information if you’re looking for a high-level overview. But in our opinion, that’s a waste of all its capabilities and reporting options.
Databox works best when you have a clear idea of what you’re looking to learn from it. So instead of adding metrics haphazardly, get specific. Ask yourself questions like:
- What are the main goals of our current marketing strategy?
- What metrics will signify monthly successes or places where we can improve?
- What areas have we been focusing on this month? How can that be represented in our databoards?
- What metrics aren’t part of our current strategy? Can we remove them from our boards?
- What data sources have we worked on growing this month?
- Do month-to-month comparisons work best for our team? Year-over-year? Both?
- What areas require more specificity? (E.g. Is an overall tracker of traffic enough for your team, or would it be more instructive to see graphs that breakdown data sources?)
- What visual would best help us process the provided data?
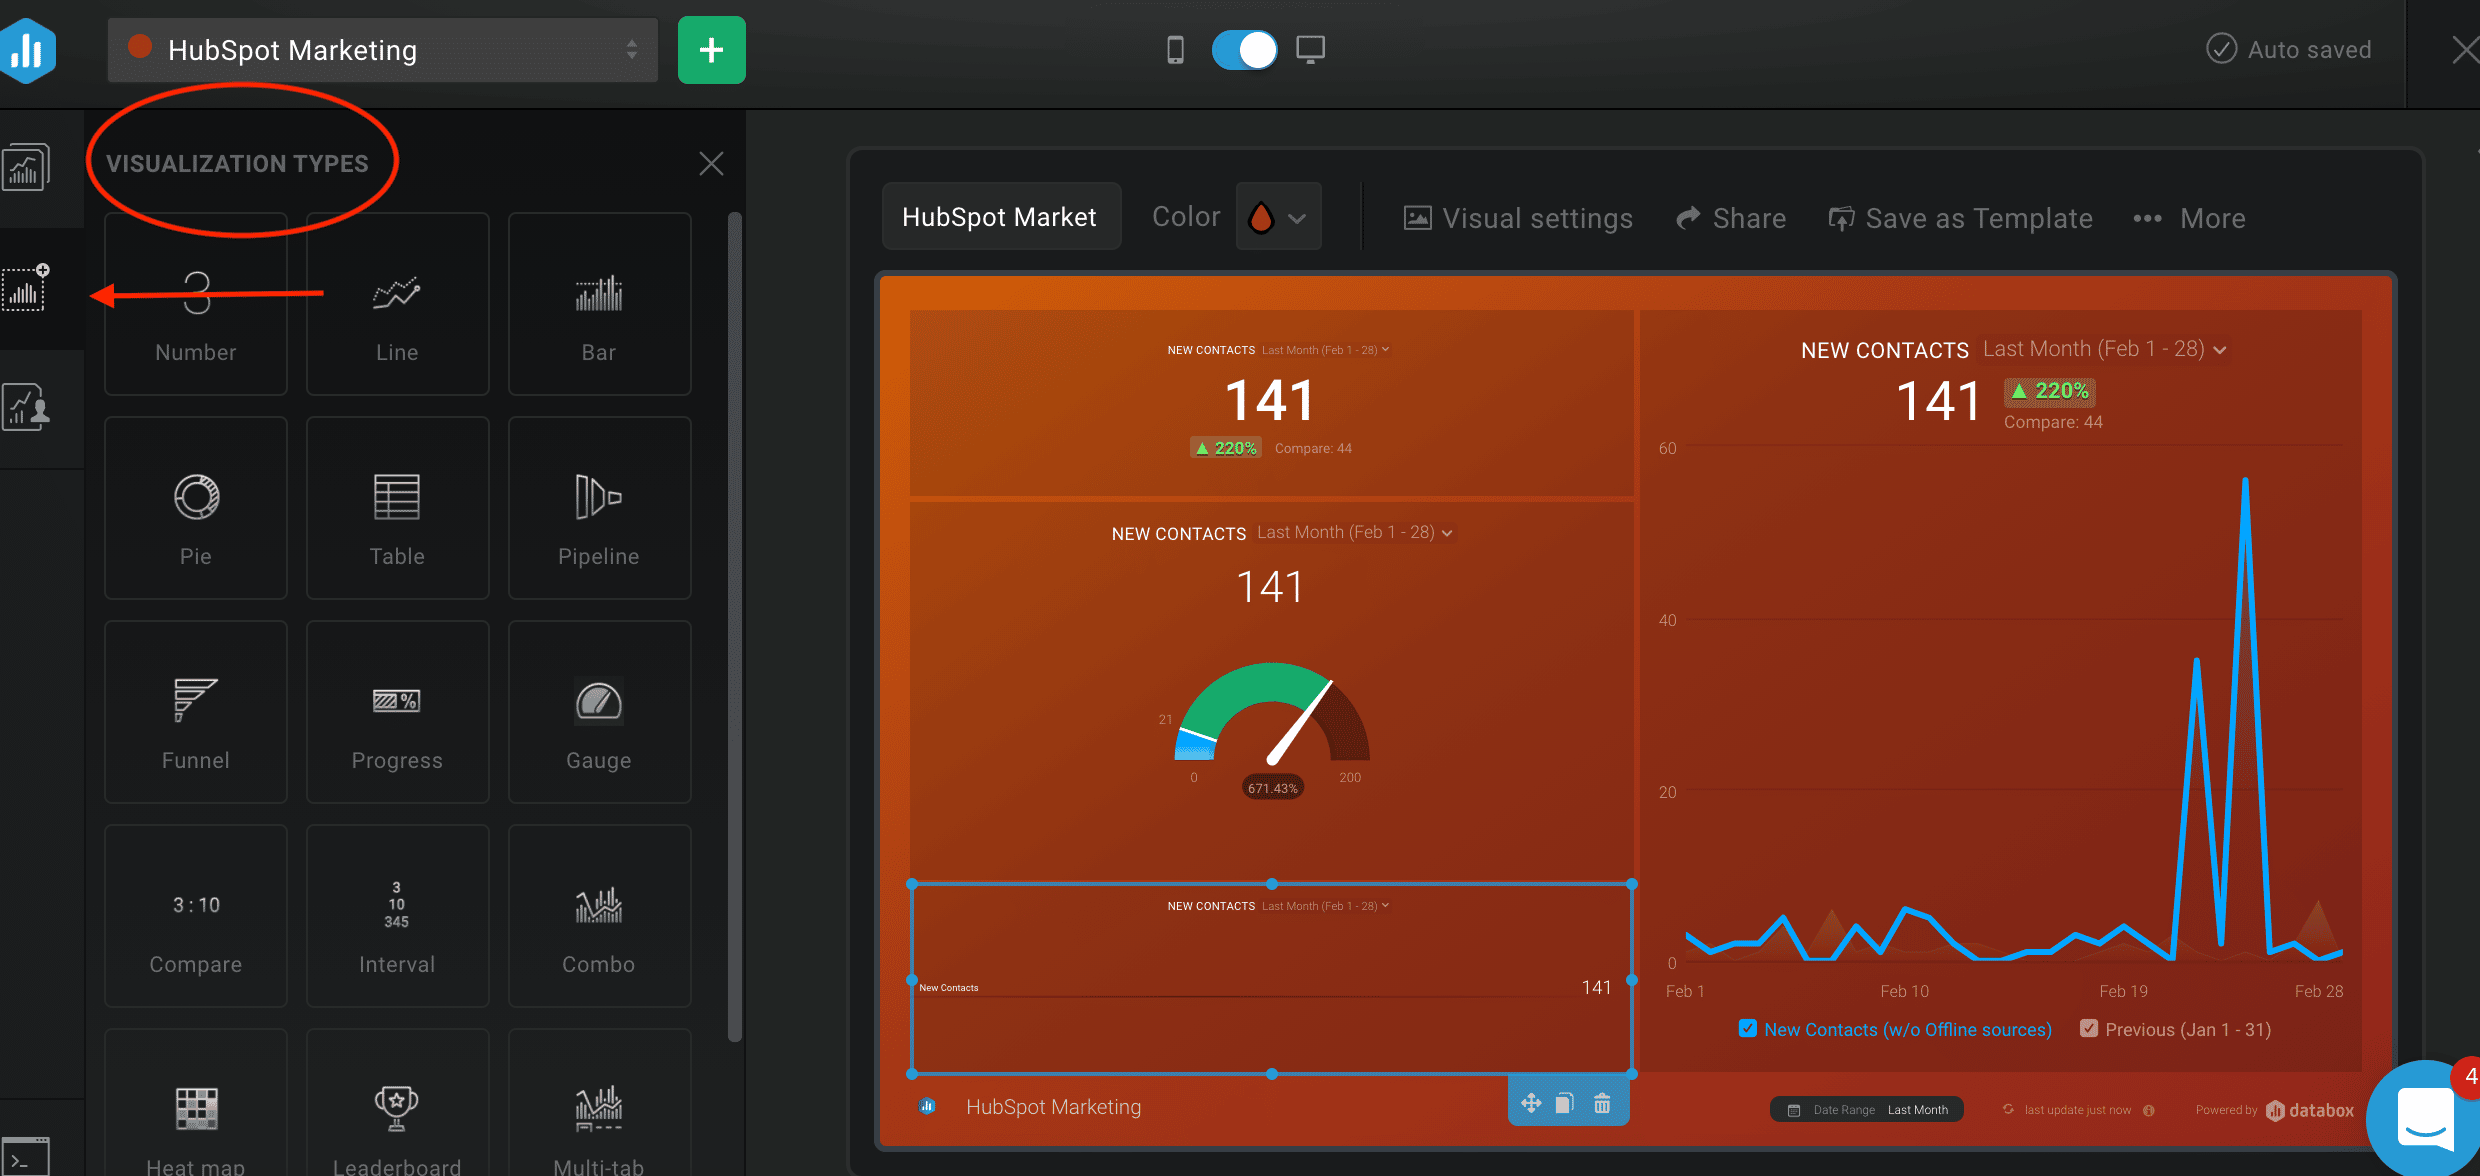
TIP: When editing your databoards, the visualization tab allows you to add different visual styles, like pie charts, graphs, funnels, etc. Below, I have the same metric of new contacts from HubSpot but formatted in several different ways. Choose the style that will be most helpful for your team.
Answering these questions will help you streamline your Databox reports. You’ll spend less valuable databoard real estate on metrics that aren’t as important and more on the ones that give an accurate portrayal of your monthly progress.
Add Your Goals
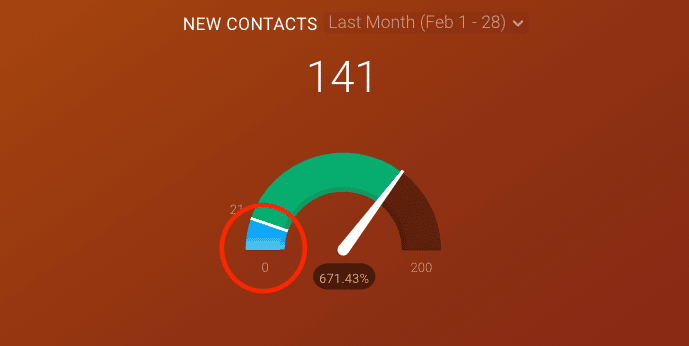
And finally, in the Goals tab, you can customize your metrics to compare your current monthly progress with your ideal performance.

So, say you’re aiming for 25 new contacts each month. By entering this, you’ll be able to see your current performance against that goal within the Goal tab. Not only will these be tracked and reflected in that tab, they’ll also be added to certain databoard visuals, as seen below.
Start Reporting
With these tips, you’ll be more than ready to set up an organized, helpful report with the information that’s most important to your team.
Since we’re using Databox for our clients, we know our way around the platform. If you’re having trouble setting up your reports, finding the right analytics to track your company’s progress or unsure where to start with reporting, we can help. Get in touch with our team here!
Steve note: Maybe we show them the final result of an exported PDF? That way, we can conclude with a “this is the final product” type of declaration which shows exactly what people will produce after they follow all of the steps listed above.
With these tips, you’ll be more than ready to set up an organized, helpful report with the information that’s most important to your team.
Since we’re using Databox for our clients, we know our way around the platform. If you’re having trouble setting up your reports, finding the right analytics to track your company’s progress or unsure where to start with reporting, we can help. Get in touch with our team here!